
Legendary investor Warren Buffet claims he shares a valuable philosophy with baseball great Ted Williams. Ted Williams once wrote that the most important thing for a hitter is to wait for the right pitch. Warren Buffet admitted he approaches investing with the exact same credo:
“…wait for the right pitch, yeah and wait for the right deal. And it will come. It’s the key to investing.” – Warren Buffet
This article will not necessarily reveal what the right pitch looks like. Ultimately, that is for you as a property buyer and/or your real estate consultant to decide. Our goal here is to undress what stadium (markets) might be best suited for today’s buyer to play ball in.
Although this technical analysis represents current residential real estate trending data, commercial real estate activity oftentimes mimics the residential trajectory—only with a lag. Therefore, in the long run, this will benefit anyone buying both residential and commercial property.
Before we get into the rabbit hole, let’s quickly define the three potential stadiums. And assure we’re all dancing to the same song. Here they are:
- Long term secular downtrend markets
- Equilibrium markets
- High momentum cyclical markets
To best compare the differences, we will use technical analysis trend charts. I compiled this data from the Housing Alerts tool that I and other insiders use—an analysis tool developed by Ken Wade. As you know, technical analysis measures market psychology and buyer behavior. This sort of analysis does not use single family median home prices in the analysis.
When scanning these colorful graphs below, keep in mind that:
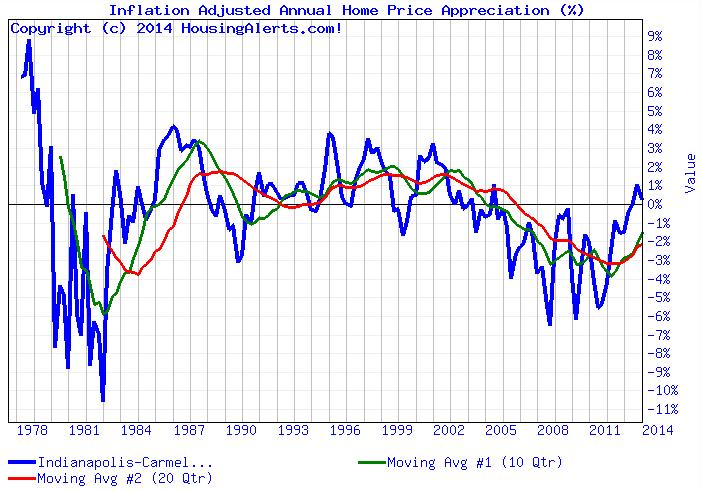
Blue line = short-term momentum indicators
Green line = intermediate-term momentum indicators
Red line = longer-term momentum indicators
The key word here is momentum. Candidly, the long-term red line is our top priority. However, don’t underestimate the importance that the shorter-term blue line plays in setting the course for the intermediate and long-term metrics to follow.
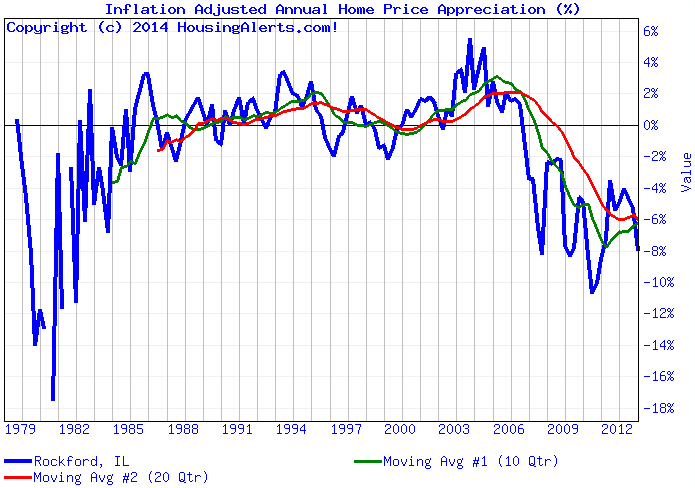
Long term secular downtrend markets are characterized by a slow and steady perpetual decline—even missing the 2007 housing bubble. Indianapolis, Indiana and Rockford, Illinois would be two examples of long term secular downtrend markets.
Indianapolis
Rockford
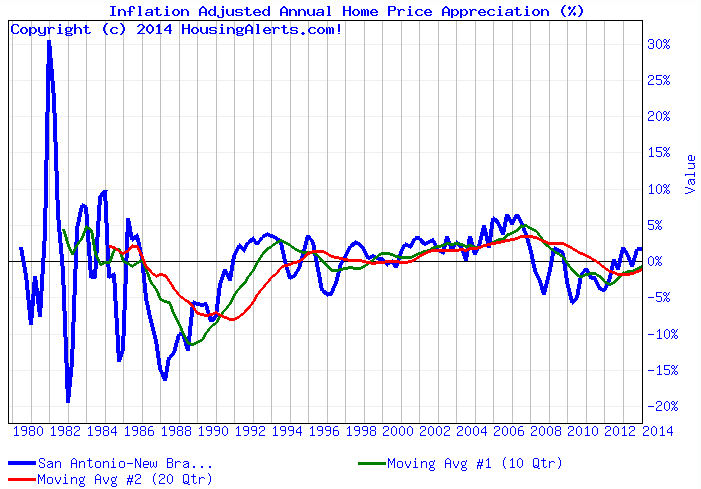
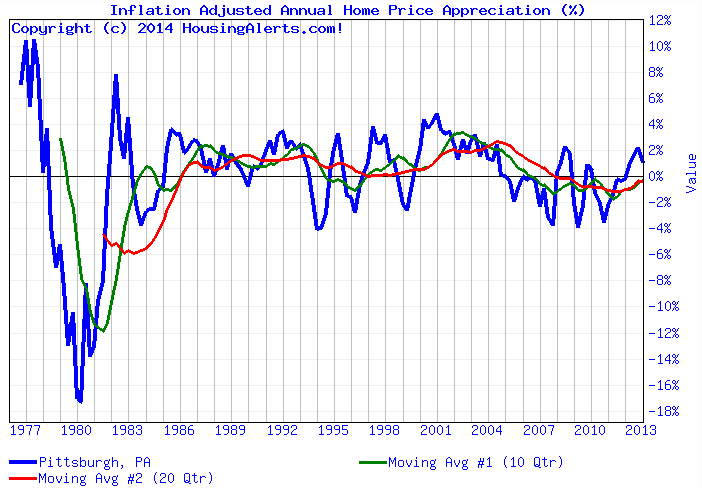
The next stadium is the equilibrium markets. Equilibrium markets are characterized by a narrow valuation of slightly positive; slightly negative. They barely offer 4% positive or negative annual home appreciation. Two prime examples of equilibrium markets are (1) San Antonio, Texas and (2) Pittsburg, Pennsylvania.
San Antonio
Pittsburgh
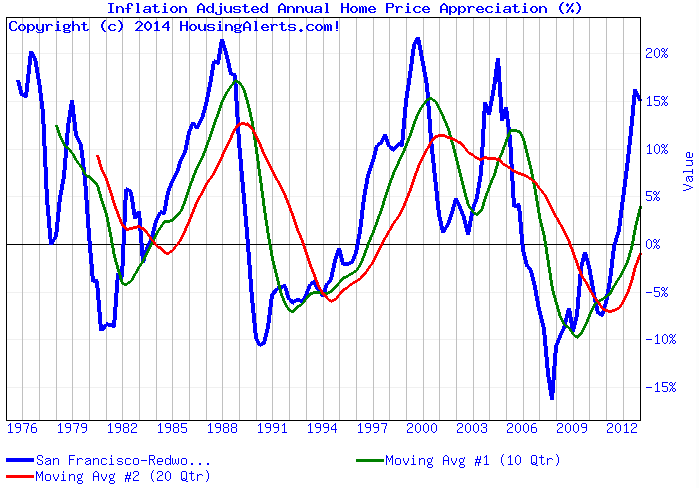
And the final stadium — and certainly the most appealing—is the high momentum cyclical markets. What’s obvious about high momentum cyclical markets is their characteristic ‘roller coaster’ like trend chart. Many cities along the west coast in America, Chicago and New York are examples of high momentum cyclical markets.
Therefore, high momentum cyclical markets are unique in that there is enormous wealth creation—and destruction—potential when playing in these stadiums. Especially, from an investor’s point of view. And that’s the point to nail down. If you are buying property, it pays to know these details.
For example, capitalizing on annual appreciation in equilibrium and long-term secular downtrend markets could be a less reliable source of capturing equity—because you can’t benefit from appreciation leverage if appreciation is non-existent. Therefore, aside from the potential cash flow created from rental income, upside profit in these two markets may be constrained by the lower kinetic energy characteristic of equilibrium and long term secular downtrend markets.
Like a windmill located in a gusty corridor, however, high momentum cyclical markets offer hitters (buyers and investors) a continuous velocity of energy. With that said, you still have to wait for the right pitch. Pick the wrong deal and you’ll strike-out no matter what stadium you play in. The good news is you can swing on many deals in any stadium if that local market is in its wealth phase.
Do wealth phases matter?
If you ask some experts, they’ll tell you that wealth phases are single-handed the most important factor determining your success. If the government causes the leverage cycle to change course—which they do from time to time—then you will watch as your exit strategy disappears right from under your nose. And that is a sure fire way for your capital as a consumer to evaporate.
For the remaining discussion, let’s zoom in on two prime high momentum cyclical markets in America. If you were interested to know what wealth phases look like, then you’re in luck because you’re about to see how these appear from a technical analysis perspective.
One of these two high momentum cyclical markets entered its wealth phase two years ago (as you will see below). And the boat has yet to set sail on the other prime high momentum cyclical market—but it’s about to. Therefore, you might find both of these to be a good bet now.
Meanwhile, on closing, let’s toss in a snapshot of Las Vegas for the mere sake of reinforcing ‘why’ we need to consider an aerial view of each local market; and remain sensitive to what type of stadium each is defined by.
For starters, take an insider look at these two well-known, yet quite different, high momentum cyclical markets: San Francisco and Chicago.
San Francisco
Chicago
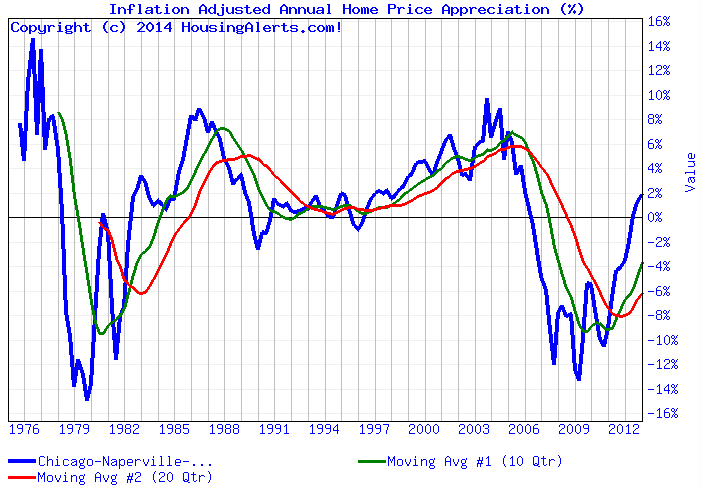
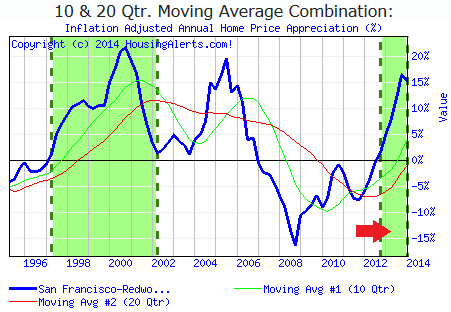
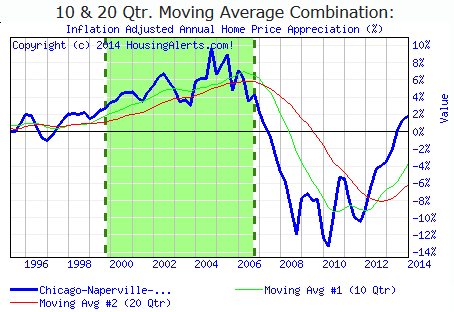
Clearly, these two local markets appear very different. Despite the fact they are the same type of stadium. As far as their wealth phases go, they are different in timing, duration and magnitude. As you can see by their wealth phases below (green dashed areas), the San Francisco wealth phase is notorious for starting two to three years ahead of Chicago. In fact, you can see that our technical analysis reveals Chicago has yet to enter its next wealth cycle.
San Francisco wealth phase indicator
Chicago wealth phase indicator
Meanwhile, this tool alerted residential real estate investors to enter the San Francisco market (red arrow above) not much sooner than two years ago. So what’s the point?
The point is: this is the sort of information you should be expecting from your advisor. If your real estate consultant is unaware of (i) what type of stadium they are playing in and (ii) the wealth phase of that local market, then it’s your duty as a buyer or investor to vet this.
Don’t hang your hat on your real estate broker’s sales pitch. How many property buyers lost loads of money by taking their broker’s advice at face value; all while underestimating how their local real estate market responds to the leverage cycle?
All the professional experience in the world is meaningless if you get blindsided by a permanent market cycle reversal. Or worse, prematurely assume a local market has started a recovery with positive annual home appreciation when, in fact, it hasn’t.
The reason why I mentioned Chicago as a good bet for property buyers at this time is because of the timing that Chicago follows relative to San Francisco. Not only that, I have been following the technical analysis on these two cities for at least three years now. Chicago looked terrible until recently. As of late, Chicago has demonstrated the consistent and much needed escalation of short-term momentum (blue-line) needed for full reversal of its intermediate and long-term inertia.
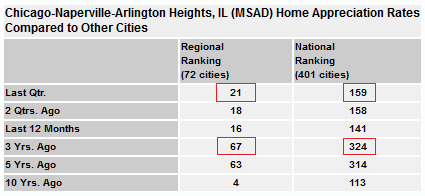
For example, check out this regional and national comparison (last quarter vs. three years ago) for Chicago below. It is clear that home appreciation levels have drastically improved as compared to other regional cities—it’s about time.
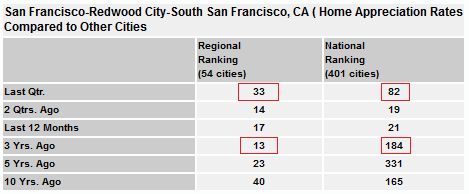
San Francisco’s regional comparison (last quarter vs. three years ago) has worsened slightly. Undoubtedly, San Francisco still remains a rock solid market opportunity to date. This data suggests that San Francisco might experience a short-term speed bump while its long-term yearly home appreciation trajectory upwardly ascends further.
From these and other findings, I base my conclusion that property buyers might benefit from strategically buying in the Chicago market at this time; not only San Francisco.
So what about Las Vegas? Historically, Las Vegas would be considered an equilibrium market. As witnessed by its DNA chart. However, what’s intriguing about Las Vegas is how it’s acted like a high momentum cyclical market as of late.
Las Vegas
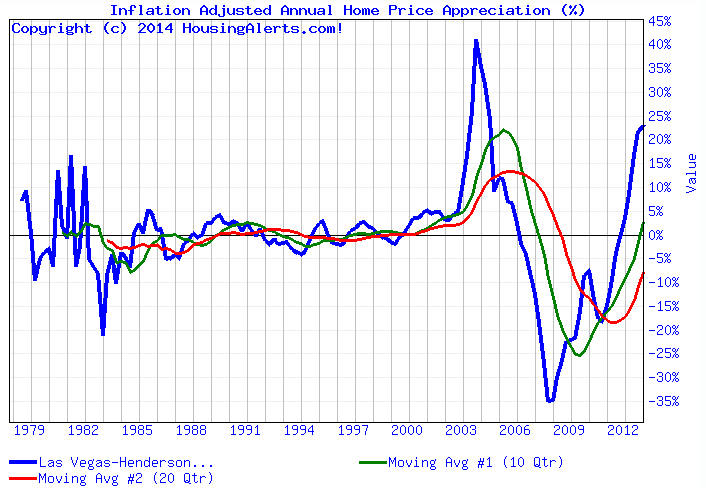
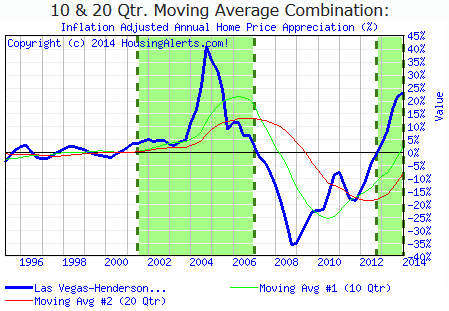
As these charts reveal, Las Vegas experienced the start of another wealth phase about the same time as San Francisco. How will Las Vegas perform over the long run? In other words, will the long-term momentum (red line) trend flatten out and resume its historic performance? Or will Las Vegas morph into a true modern day high momentum cyclical market? That is the million dollar question.
Las Vegas wealth phase indicator
Undoubtedly, you can earn good yield in any local market; if you maintain razor sharp awareness of that market. My personal bias leans toward the Chicago, New York and San Francisco types because I am fond of tall buildings; not because I like roller coasters.
No matter what stadium you enter, be sure you and your real estate broker or real estate consultant acknowledge the local wealth phase. And how it’s responding to the government controlled (secondary market) leverage cycle. Then, when you get that right pitch—swing for the fences.