
Is it a buyer’s market? or a seller’s market?
Knowing absorption rates when buying or selling real estate is key for negotiating a good deal.
Yet, few have this information at their fingertips.
Oftentimes, a broker will provide an absorption rate for the current month… because perhaps they calculated it before meeting with a client.
This is good.
But a current month’s absorption rate won’t reveal any trend… it only shows the rate for that month. A single month doesn’t tell a story.
Therefore, it’s preferable to track and note absorption rates each month because it will show the past trend. It’s rare information such as this which can be used to gain an edge in a negotiation… to push for a low offer.
Especially, in downtown Chicago. It’s a jungle. Many of the properties are tall buildings: Condos.
When real estate markets start to reverse for the worse, condos tank first. And when markets starts to recover for the better, condos come-up last.
(so proper data is key)
Here at HK® Luxury Realty, we specialize: and track absorption rates each month for select areas in downtown Chicago’s luxury real estate market. It gives me a feel for the landscape.
I do this for 11-zipcodes in these downtown Chicago hoods:
River North, Gold Coast, Magnificent Mile, Streeterville, LakeShore East, the Loop, West Loop, South Loop, Printer’s Row, Randolph Market, Fulton Market, Greek Town, Museum Park, Prairie District, Old Town, East Lakeview and Lincoln Park.
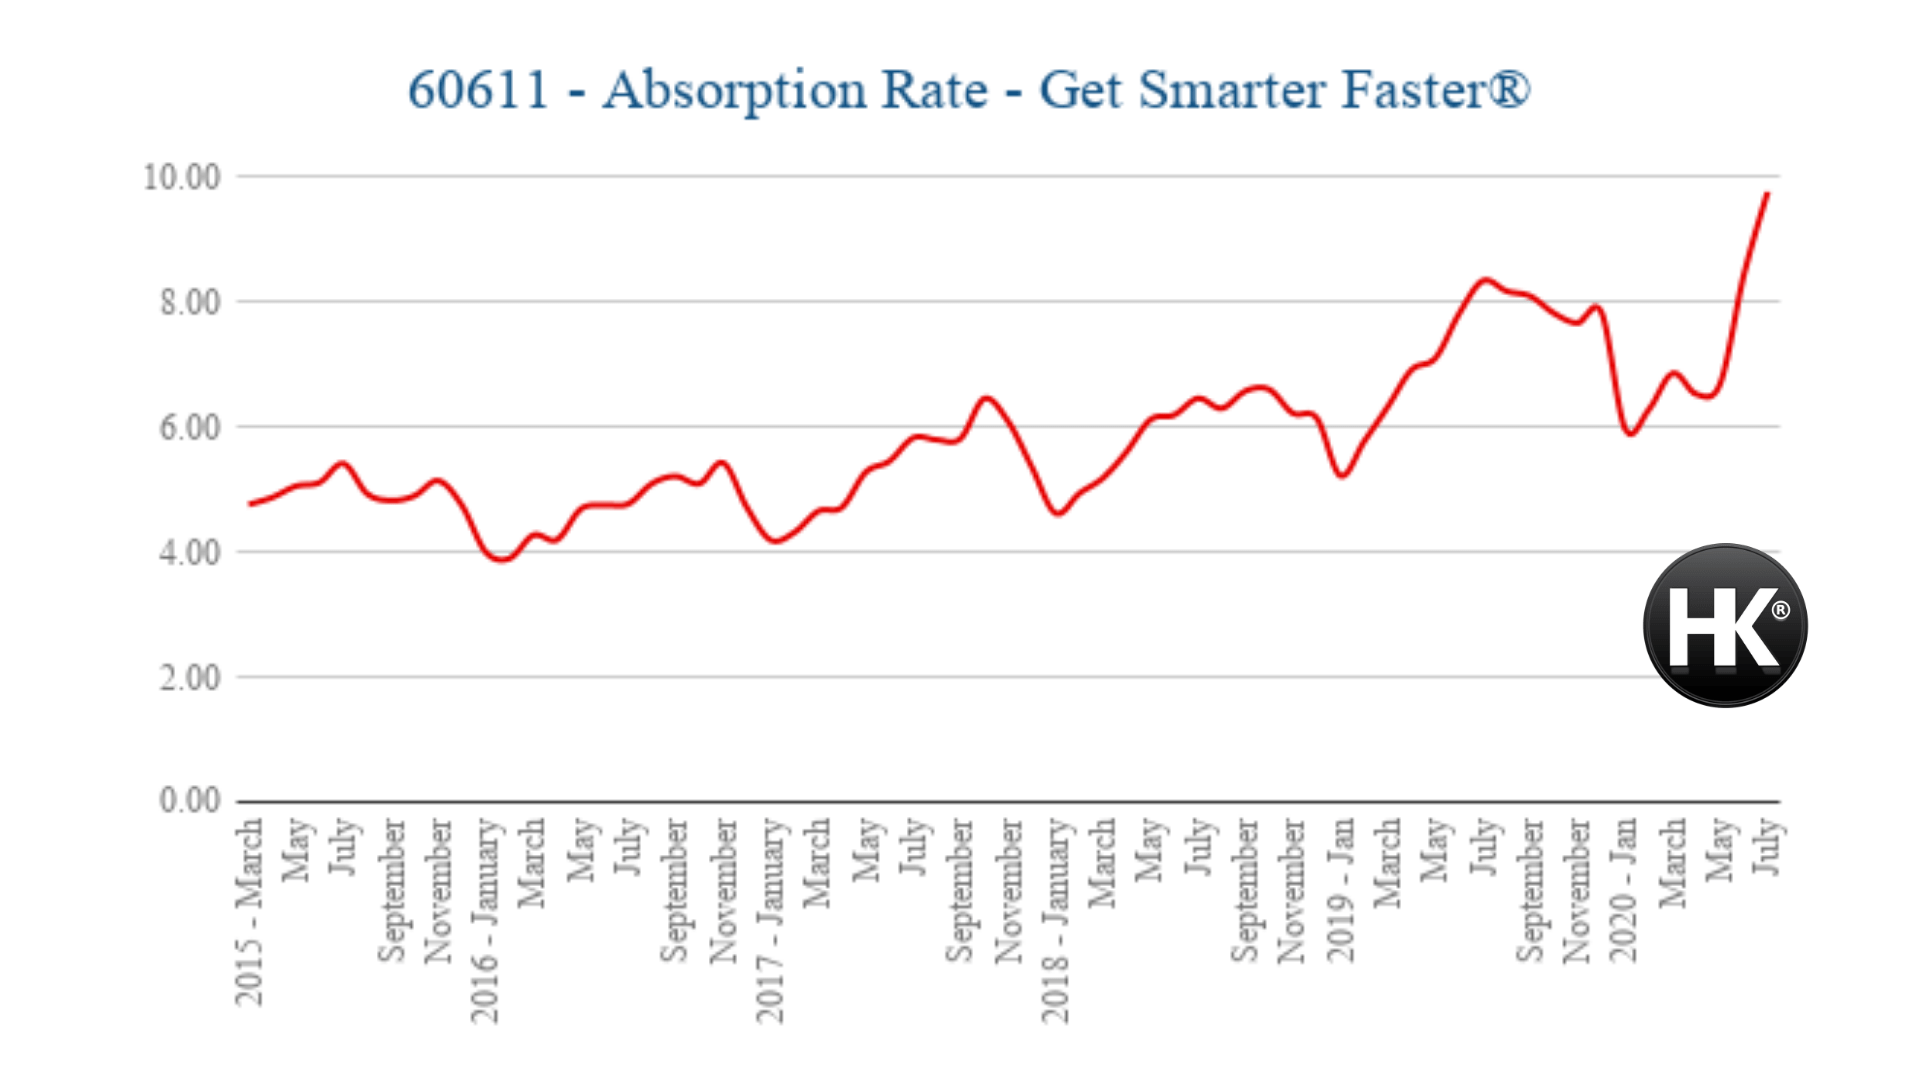
Here’s one example of the absorption rate in a popular downtown Chicago zip-code.
Absorption rate for the month of May, six years in row.
[using a 12-months back timeframe]
2020 July (840 Closed sales) – Abs Rate 9.77
2020 June (889 Closed sales) – Abs Rate 8.45
2020 May (947 Closed sales) – Abs Rate 6.70
2019 May (1,055 Closed sales) – Abs Rate 7.1
2018 May (1,138 Closed sales) – Abs Rate 6.13
2017 May (1,1179 Closed sales) – Abs Rate 5.28
2016 May (1,117 Closed sales) – Abs Rate 4.69
2015 May (1,117 Closed sales) – Abs Rate 5.06
Clearly, this downtown Chicago lakefront zip-code is trending above six, which means a buyer’s market slowly emerged in late-2019.
NOTE: By definition, the absorption rate indicates how long (how much time) it would take for all ACTIVE inventory in a given area to sell—assuming no new homes were added to the market. In other words, the pace at which all currently listed homes would be ‘absorbed’ by buyers—if no new homes were added.
An absorption rate below 6 months is indicative of a seller’s market; while a rate above 6 months would indicate a buyer’s market. Technically, you could assume an absorption rate of 6 months to be a balanced market.
Here’s what you need in order to calculate the absorption rates in your area:
1. A timeframe (I use 12-months back)
2. # of closed sales within that timeframe
3. # of active homes currently for sale on the market
Downtown Chicago areas we service: River North, Gold Coast, Magnificent Mile, Streeterville, LakeShore East, the Loop, West Loop, South Loop, Printer’s Row, Randolph Market, Fulton Market, Greek Town, Museum Park, Prairie District, Old Town, East Lakeview and Lincoln Park.
Get in touch & buy downtown Chicago luxury apartments smarter >>